| |
 |
|
|
| PROCESS PIPING |
|
| |
|
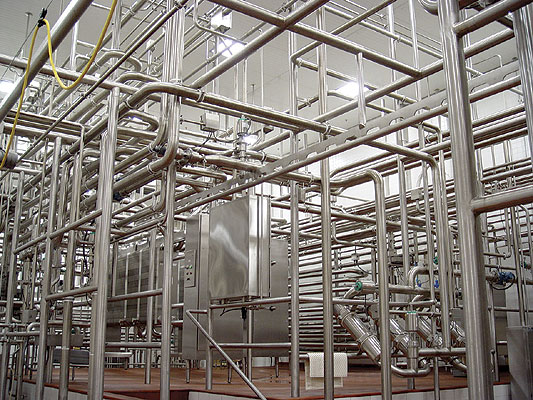
What is process piping system
Piping system: conveys fluid between locations .These can
be any fluid .(air,water ,milk,solvents)
Piping system includes:
•Pipe
• Fittings (e.g.
elbows, reducers, branch connections, etc.)
• Flanges, gaskets,
bolting
•Valves
• Pipe supports
|
|
 |
|
| Types of Process Diagrams Process diagrams
can be broken down into two major categories:
process flow diagrams (PFDs) and process and instrument
drawings (P&IDs),
sometimes called piping and instrumentation drawings. A
flow diagram is a simple illustration that uses process
symbols to describe the primary flow path through a unit.
A process flow diagram provides a quick snapshot of the
operating unit. Flow diagrams include all primary equipment
and flows. A technician can use this document to trace the
primary flow of chemicals through the unit. Secondary or
minor flows are not included. Complex control loops and
instrumentation are not included. The flow diagram is used
for visitor information and new employee training.
A process and instrument drawing is more complex. The P&ID
includes a graphic representation of the equipment, piping,
and instrumentation. Modern process control can be clearly
inserted into the drawing to provide a process technician
with a complete picture of electronic and instrument systems.
Process operators can look at their process and see how
the engineering department has automated the unit. Pressure,
temperature, flow, and level control loops are all included
on the unit P&ID. |
|
 |
|
| Basic Instrument Symbols Process
technicians use P&IDs to identify all of the equipment,
instruments, and piping found in their units. New technicians
use these drawings Knowing and recognizing these symbols
is important for a new technician. The chemical processing
industry has as- signed a symbol for each type of valve,
pump, compressor, steam turbine, heat exchanger, cooling
tower, basic instrumentation, reactor, distillation column,
furnace, and boiler . There are symbols to represent major
and minor process lines and pneumatic, hydraulic, or electric
lines, and there is a wide variety of electrical symbols.
Some symbols are common among plants; others differ from
plant to plant. Some standardization of process symbols
and diagrams is taking place. The symbols used in this chapter
reflect a wide variety of petrochemical and refinery operations.
Typical process symbols |
|
|
|
Flow Diagrams
New technicians are required to study a simple flow diagram
of their as signed operating system. Process flow diagrams
typically include the major equipment and piping path the
process takes through the unit. As operators learn more about
symbols and diagrams, they graduate to the much more complex
P&IDs. |
|
| |
|
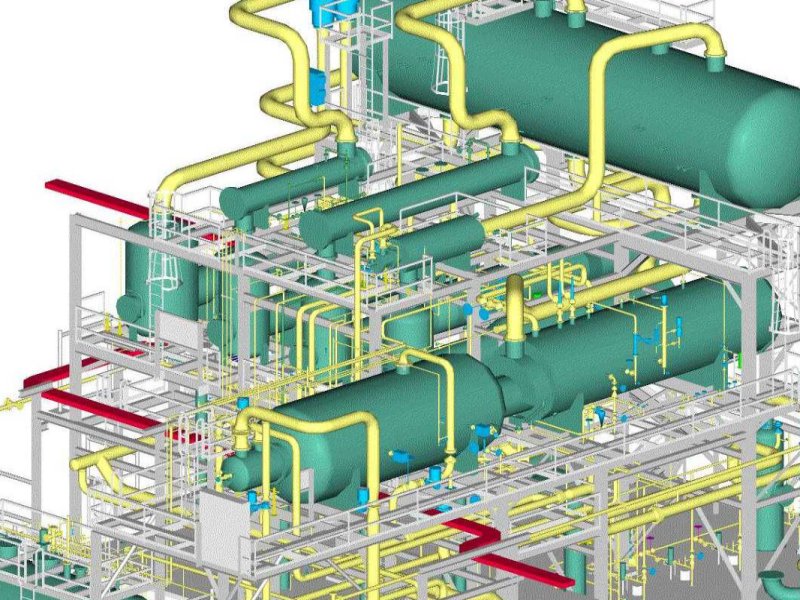
Equipment Location Drawing
Equipment location drawings (plot plans) show the exact location
of equipment in relation to the plant’s physical boundaries.
One of the most difficult concepts to explain to a new process
technician is the scope and size of modern chemical processing.
Most chemical plants and refineries closely resemble small
cities; they have well-defined blocks and areas connected
by a highway of piping and equipment. Equipment location drawings
provide information about the neighborhood.
|
|
| |
|
| Loop Diagrams A loop diagram traces
all instrument connections between the field instrument
and the control room panel. This includes instrument air
lines, wiring
connections at field junction boxes, and control room panels
and front connections
connections.
• Process
Piping Software |
|
|
|
|
|
|
|
|